Interactive Map Tracks NYC Evictions & The Landlords Who File For Them
May 7, 2019, 1:03 p.m.
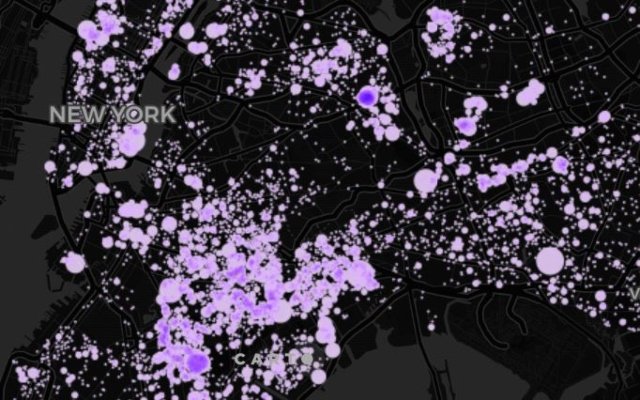
The Worst Evictors NYC website shows a concentration of evictions in central Brooklyn, East Harlem, and the South Bronx.
A collaboration between a group of housing rights advocates has produced the most comprehensive database yet to measure evictions across New York City and identify many of the landlords responsible for them.
Three advocacy groups — Right to Counsel NYC Coalition, JustFix.nyc, and the Anti-Eviction Mapping Project — on Monday launched a website, www.worstevictorsnyc.org, that incorporates newly analyzed and vetted public data as well as knowledge from tenant organizers. Users can zoom in to get a block-by-block picture of where city marshals are carrying out evictions and also, in many cases, learn who the associated landlords are. Users can also elect to map evictions by landlord.
This is by no means the first interactive eviction map: JustFix.nyc, one of the groups behind the new map, launched a mapping tool in 2017 that drew on eviction lawsuit filings. Less than 10 percent of eviction filings result in actual evictions, often because tenants choose to move out before city marshals show up.
The new site’s collaborators say that thanks to meticulous efforts to verify and standardize multiple datasets, Worst Evictors NYC represents the most accurate and comprehensive eviction data to date that has been made available to the public. In the past, New York City’s eviction data has been unwieldy for housing and policy analysts to analyze, saddled with duplicates and formatting errors, and not geocoded or matched to particular buildings.
"The way the [city] data is provided is essentially unusable for analysis," said Sam Raby, the research and data lead for JustFix.nyc.
As a result, the website represents a significant upgrade over the City Council’s eviction data mapping tool, which was created by the then-acting Public Advocate and City Council Speaker Corey Johnson and the City Council in February. That tool, which relied on data culled from the NYC Open Data website, revealed higher total eviction numbers than those reported that same month by the de Blasio administration.
At the time, the mayor’s office issued a press release trumpeting a 37% decrease in evictions, to approximately 18,000, while the City Council’s report listed 19,970 evictions in 2018. Adding to the confusion, the NYC Open Data website showed 21,811 evictions for 2018.
According to Jennie Laurie, executive director of Housing Court Answers, one possible reason for the discrepancies is the two different data sources used. NYC Open Data publishes a spreadsheet that contains data compiled by a “majority of New York City Marshals.” The mayor’s office, meanwhile, relies on direct annual reports from the city marshals’ office, which are likely to have been reviewed for duplicates and use the same methodology year to year.
Manon Vergerio, the NYC chapter coordinator for the San Francisco-based Anti-Eviction Mapping Project, said that a crew of volunteers, including those at the Housing Data Coalition, another civic group dedicated to coding and understanding city data, spent “many, many hours” going row by row through spreadsheets to find duplicates and standardize the entries.
All told, their efforts found that there were 18,007 evictions carried out by marshals in 2018, The number was actually slightly less than those reported in the city marshals’ report, which counted 18,152 evictions.

Tenant organizers attend a rally for a bill that would strengthen the city's right-to-counsel law. (Elizabeth Kim / Gothamist)
Similar to other interactive maps, the latest site shows a concentration of evictions in central Brooklyn, East Harlem, and the South Bronx.
To connect evictions with landlords, whose identities are often obscured by limited liability companies, JustFix.nyc used data collected by the city Department of Housing Preservation and Development, which lists the “head officer” of each apartment building. To get a sense of how often landlords sue tenants, the group’s data analysts also matched buildings with those that appeared in eviction cases filed between January 2013 and June 2015, the most recently publicly available data on court filings, which may or may not have resulted in evictions. (Going forward, the groups are asking the city and state to make all data on eviction cases publicly available.) The group also consulted with tenant organizers who have built up a familiarity with landlords over the years.
Using that information, the team was able to build a “2018 Worst Evictors List,” which identifies and profiles landlords who evicted the most tenants in zip codes where the right-to-counsel law is currently in effect.
Susanna Blankley, a coordinator at Right to Counsel, said the project, which took several months, seeks not only to highlight the raw numbers on eviction data, but the way that landlords use housing court as a harassment tool against tenants. "Who are the landlords who sue people the most? And how can we do outreach [to tenants]?" she said.
Blankley's group was responsible for pushing the City Council to pass the country’s first right-to-counsel legislation in 2017. The law, which is being gradually phased in zip code by zip code, gives low-income tenants the right to free legal services during eviction cases. The group, with the support of councilmembers Mark Levine and Vanessa Gibson, is currently pushing to strengthen the law by increasing the number of people who qualify for a free attorney and mandating city funding to tenant organizing groups to spread the word about the law.
According to a report issued last fall by the city Human Resources Administration's Office of Civil Justice, 84 percent of tenants who received free legal representation from OCJ under the right-to-counsel law were able to avoid eviction and stay in their homes. Comparable numbers for tenants without counsel are unavailable, according to a Community Service Society report.
UPDATE: A previous version of this story inaccurately said the group matched the names of building head officers with names that appeared in eviction cases. Party names are not revealed in the data that was released on eviction cases.